
Production Dashboard for Manufacturing
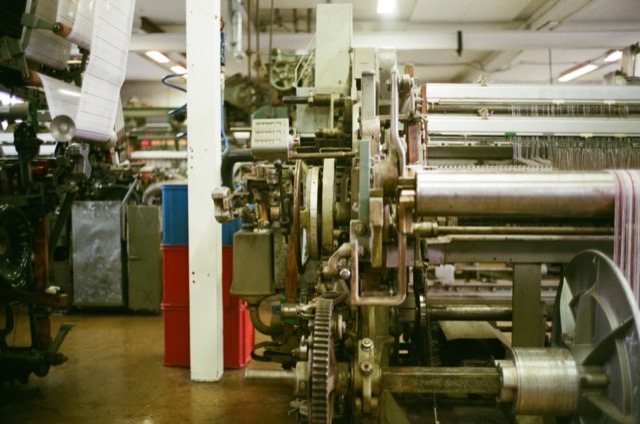
The client needed Production data on a PowerBi solution. Although the data was available it was not usable in its current form. Our solution was to write ETL pipelines to a new Data Storage on Cloud with low read / write utilization as this is only going to be performing OLAP queries that are long-running and done periodically. The OLAP queries would be performed on this datasource with the necessary clean-up queries where identified. This ensured that the Production database would not be affected by heavy data processing. Once that process was completed and data was verified by client-side correspondant. We proceeded with the PowerBi Dashboard creation. This allowed us to create a visually stunning and responsive Data solution. Decoupling the Analytical and Production databases allowed easy maintenance on both Production and strategic end without sacrificing up time.
Approach:
- Data Source Analysis and Requirements Gathering:
- Analyze the existing production databases and identify the required data points and KPIs (Key Performance Indicators) for the manufacturing dashboard.
- Define the data refresh frequency and reporting needs.
- Gather requirements for the Power BI dashboard layout, visualizations, and user access.
- ETL Pipeline Development:
- Design and develop ETL (Extract, Transform, Load) pipelines to extract data from the production databases.
- Transform the data into a format suitable for analysis and reporting.
- Load the transformed data into a cloud-based data storage solution optimized for OLAP (Online Analytical Processing) queries, such as a data warehouse or data lake.
- Cloud Data Storage Setup:
- Set up the cloud data storage solution (e.g., Azure Synapse Analytics, AWS Redshift, Google BigQuery).
- Configure the storage for optimal performance and cost-effectiveness.
- Implement data governance and security measures.
- Power BI Dashboard Development:
- Connect Power BI to the cloud data storage.
- Design and create interactive dashboards with relevant visualizations (charts, graphs, tables) to display the KPIs.
- Implement data filters, slicers, and drill-down capabilities for interactive data exploration.
- Data Validation and Testing:
- Verify the accuracy and completeness of the data in the cloud data storage.
- Test the Power BI dashboard to ensure that the data is displayed correctly and that the visualizations are accurate.
- Conduct user acceptance testing with client-side stakeholders.
- Deployment and Training:
- Deploy the Power BI dashboard to a secure and accessible environment.
- Provide training to users on how to access and use the dashboard.
- Establish a process for ongoing maintenance and updates.
Results:
- Enhanced Data Accessibility: Improved access to production data, enabling data-driven decision-making.
- Real-time Insights: Provided real-time visibility into key performance indicators (KPIs), such as production output, efficiency, and quality metrics.
- Improved Decision-Making: Empowered stakeholders with actionable insights to identify areas for improvement and optimize manufacturing processes.
- Reduced Production Downtime: Proactively identified potential issues and enabled faster response times, minimizing production downtime.
- Increased Operational Efficiency: Optimized manufacturing processes, leading to increased efficiency and reduced costs.
- Scalable and Sustainable Solution: Built a scalable and sustainable data solution, capable of handling growing data volumes and evolving reporting requirements.